 As of December 17, 2015 the National Oceanic and Atmospheric Administration (NOAA) updated its forecast for the effects of potentially the “strongest El Niño in recorded history” on precipitation in California for 2015/2016. The forecast, for 120% to 140% of normal precipitation in the watershed of the American River, was great news for whitewater rafting in 2016!
Meanwhile, winter storms blanketed the Sierra over Thanksgiving and Christmas, leaving skiers and snowboarders with the best conditions in years. The snowpack was 136% of normal, as compared with 45% the previous year at the same time (Ca. DWR Dec. 30, 2015), which was right on track with NOAA’s forecast.
So what role does El Niño play in influencing weather patterns and what is the background of this forecast? The most authoritative answers are to be found at www.elnino.noaa.gov, the official NOAA website, which provides regularly updated forecasts that extend forward 3 months, as well as excellent discussions and blog articles. Headquartered at the Pacific Marine Lab in Seattle, NOAA scientists use weather satellites, over 2500 specialized ocean buoys, historical data and supercomputers to create climate models to study El Niño. Scientists use measurements of sea surface temperature (SST), ocean height, wind velocity and precipitation, all of which are compared over time. Although truly reliable data collection only began in the 1950s, dramatic advances occurred with the advent of weather satellites in the 1980s, and our current studies of El Niño represent the most extensive and sophisticated weather science effort in history!
El Niño is named the “Christ Child” because it often manifests its strongest effects around Christmas. It alternates with La Niña, “the girl child” at intervals of from 2 to 7 years which historical records suggest may becoming more frequent and more severe. The combined effects of these twins on the Earth’s weather have been so powerful that some have proposed that El Niño/El Niña deserve to be understood as the “fifth season”.
Records of human encounters with El Niño date from ancient times. A nation of sailors, the Greeks navigated the oceans extensively and Homer refers to an event some believe was El Niño in his Odyssey from over 2500 years ago. Although El Niño is primarily a tropical event involving the Pacific Ocean centered off Peru, it has distant influences and there is evidence it played a role in disrupting the Sumerian civilization in Mesopotamia. In the Americas it is likely that an El Niño destroyed the Inca civilization and that its twin, La Niña, accounted for the abandonment of the Pueblos once occupied by the “Ancients” in the American Southwest.
According to the UC Santa Barbara Anthropologist, Professor Brian Fagan, the modern scientific understanding of El Niño began due to the British occupation of India. Sir Gilbert Walker, a British mathematician, was appointed to study the monsoons when their failure caused massive social disruption in India in 1896. His analysis of weather data revealed that the trade winds flowing from east to west across the Pacific Ocean drive warm water before them, thus creating a huge pool of warm water off Indonesia. This pool evaporates forming rain clouds that in turn produce the monsoons. This “Walker Circulation” draws nutrient rich cool water up from depths of the ocean off Peru and Ecuador feeding fish and birds of the Galapagos Islands. This “Southern Oscillation” periodically slows and even reverses in direction, causing the trades to instead drive warm water toward the coast of South American with the accumulation of moist clouds over the Andes. This is El Niño, which drenches the normally dry coast of Ecuador and Peru but simultaneously desiccates India, Indonesia and Australia. The interconnection between El Niño and the Southern Oscillation is the “Bjerknes Hypothesis” which is now widely accepted. The appropriate acronym is therefore “ENSO” or El Niño Southern Oscillation.
Today the ENSO is defined as a condition in which sea surface temperatures (SST) are either above (El Niño) or below (La Niña) historical averages thus forming a temperature “anomaly” in a band of ocean stretching from the coast of Central and South America toward Tahiti along the equator. This is the “eastern central Pacific Ocean” which is divided by NOAA into zones 1 through 4 with the area that has proven to be most predictive of weather patterns being zone “3.4” (5 degrees N by 5 degrees S, 170 degrees W by 120 degrees W).
To appreciate the potential scale of El Niño related events, to warm the water involved in the current El Nino from normal to its current 3.6 degrees F above normal, would require more energy than the total amount used in the United States in a year (100 quadrillion kilojoules or 95 quadrillion BTUs). The rains that fell on Peru during one extreme El Niño event delivered over 100 years of rainfall with catastrophic results. The reversal of the Walker Circulation with failure of the monsoon in India in 1896 caused the death of several hundred thousand Indians by starvation and epidemic disease. El Niño can be serious business!
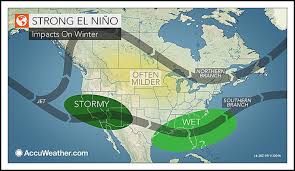
So what did the “strongest El Niño on record” have in store for rafting on the Forks of the American River in 2016? Let us begin by humbly admitting that “on record” is a very short time and forecasting El Nino is complex. Since it is centered off Peru, El Niño causes its greatest effects in Central and South American and the Southern United States. Weather events currently being observed in these regions were consistent with El Niño with flooding and violent storms. The fact that NOAA forecast a relatively modest increase in precipitation in the American River watershed was due to the fact that we are on the outer edge of El Niño’s influence. This distance also affects the timing of events which peak prior to Christmas in Peru, but in California peak in January, February and March.
It is important to realize that El Niño events do not account for even the majority of Northern California’s extreme weather. For example, careful examination of records reveals that the historic flood that occurred in the American River Canyon on December 31st 1996 through January 1st, 1997, the highest water level in over a thousand years, was in a neutral El Niño year! It resulted from a massive warm “Pineapple Express” storm delivered by the “atmospheric river” which melted 8 feet of early snow and the resulting runoff overwhelmed storage systems and levees causing 1.8 billion dollars of property damage in California (see last year’s blog article on the atmospheric river). It is easy to confuse this event with 1997-1998, an extreme El Niño year, which pounded Peru and the California Coast but was comparatively mild in the American River watershed causing “only” 500 million dollars in property damage California wide.
All things considered, the NOAA forecast of 120% to 140% of normal in the American River watershed turned out to be largely correct and produced great conditions for whitewater boating in 2016. Although there was early season flooding that damaged the camp, runoff was sufficient to fill upstream reservoirs depleted by drought and the resulting storage was sufficient to provide robust rafting flows on the dam controlled South and Middle Forks of the American not only for 2017, but 2018 as well. Old timers will tell you that when the Folsom Reservoir was completed in 1954 it was expected to take five years to fill. Instead, a massive rain event filled it in 48 hours! Forecasting aside, Mother Nature is still in charge, so we should remain alert and stay tuned for NOAA updates.
See you on the river,
Scott the RiverDoc and Charlie the RiverDog
For more information:
Visit NOAA at www.elnino.noaa.org
Brian Fagan: Floods, Famines and Emperors: El Niño and the Fate of Five Civilizations, 2009 edition
National Geographic Magazine: December 2015 issue
Wikipedia: El Niño